
Articles — May 12, 2026

Where do a food company’s Scope 3 emissions come from? Calculating emissions throughout the value chain may seem laborious, but you can start lightly and deepen data accuracy along the way.
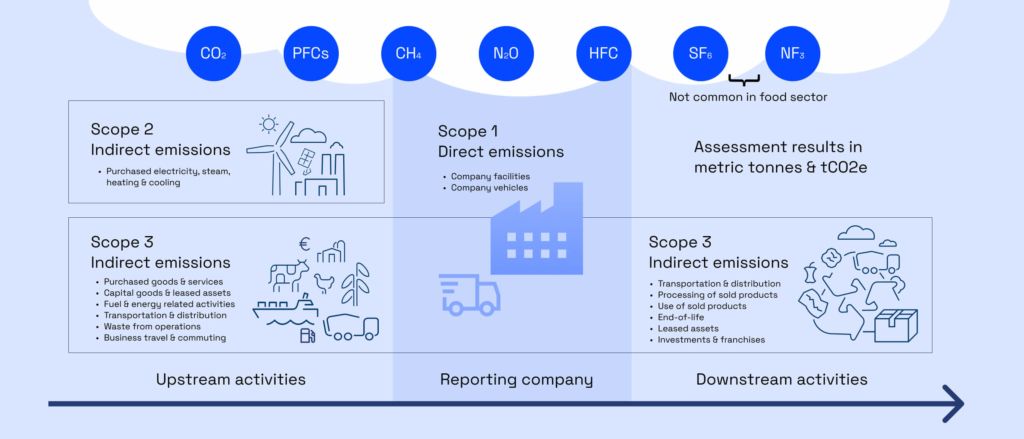
In the GHG Protocol, carbon dioxide emissions are divided into three categories: scopes 1, 2, and 3. Of these, Scope 3 represents emissions generated in a company’s value chain, which are also mandated to be reported by the Corporate Sustainability Reporting Directive (CSDR).
Scope 3 has 15 subcategories classified as upstream and downstream emissions, depending on when emissions occur in the production process. Upstream emissions occur before the company receives the product, and downstream emissions occur after the company has sold its manufactured product.
For food companies, a significant portion of emissions is generated from the raw materials used in processes, emphasizing upstream emissions in emission calculations. Although the upstream and downstream categorization does not have a direct impact on emission figures, it makes it easier to examine where emissions are generated. Additionally, uniformly categorized results are easier to compare, for example, between different years.
The primary emission sources at the beginning of a company’s value chain include:
For food companies, purchased services and goods often consist of food ingredients, with the majority of emissions originating from agriculture, including cultivation and meat production. However, raw materials can also be other purchased products or services.
Capital goods, on the other hand, refer to items, products, and services acquired for long-term use, such as investments in a new factory building.
In the overall picture, smaller emission sources often include business travel and commuting. Upstream emissions in transportation include the transportation of raw materials to the factory facilities. Additionally, waste generated in the company’s manufacturing process is included.
Downstream encompasses everything for which the company is no longer directly responsible. The company’s responsibility can refer to either financial or operational responsibility, depending on the scope of the calculation.
Downstream emission sources include:
Franchise operations Transportation of products refers to the distribution of manufactured products to stores. Handling of sold products means that the company sells, for example, its flour to another company that uses it to bake pastries.
The end-of-life product phase includes the disposal of products, i.e., waste management, and also how consumers use the product. In the case of food products, this usually involves some form of electricity or energy consumption, such as refrigeration or cooking.
In carbon footprint calculations, data collected and used is classified into primary data and secondary data. Primary data is collected directly from original sources, while secondary data is information collected and published by someone else.
The carbon footprint calculation process includes an initial assessment, which evaluates various emission sources and also considers where to use primary data in the calculation. In the initial assessment, it is also important to justify the points where primary data will not be used.
Collecting primary data is often labor-intensive, but it is a significant part of the calculation. A good rule of thumb is that at least the largest emission sources should be calculated using self-collected data, as it improves the reliability of the result. The key is to weigh how significantly the use of primary data affects the final outcome.
For Scope 3 value chain emissions, primary data is most easily available for activities related to the company’s own operations. These may include purchased products, waste generated in the manufacturing process, commuting, and business travel.
In contrast, it is often difficult to obtain precise information about emissions at the end of product life, as consumer behavior often influences them. In the final stages of a product’s life cycle, the use of secondary data is often justified, and estimates are sufficient, for example, for how long a consumer stores a product in the refrigerator.
Ultimately, what matters is calculating emissions, whether using self-collected data or estimates. Calculations based on secondary data can also be a good first step into the world of emission calculations. Based on rough estimates, you can identify the largest emission sources and then seek more accurate data.
It is essential, already in the initial assessment phase, to clarify whether the goal of the calculation is to know the emissions of each activity precisely or to understand where emissions are generated in the first place. Setting the goal affects how data should be collected.
It’s a good idea to start preparing for value chain emissions calculations. The CSRD soon obliges companies to report emissions, including Scope 3 emissions according to the GHG Protocol. In addition to the requirement, calculating value chain emissions also reflects all the choices a company makes.
For most companies, value chain emissions are the largest source of emissions. Therefore, calculating only the direct and indirect emissions from one’s own operations (Scope 1 and 2) may distort the overall picture.
Understanding value chain emissions also helps to influence them in practice. Using calculation results, companies can engage their suppliers and partners in climate actions.
For example, a company can encourage contract farmers to adopt more sustainable farming methods. Additionally, optimising transportation routes and switching to more sustainable fuel alternatives is a good option if transportation contributes significantly to emissions. While a company may not be able to influence on everything in their value chain, having the information is a great first step.
Calculate your company’s climate impact with Biocode and take control of value chain emissions calculations today!
What can you expect from a demo with Elina?