
Webinars — Sep 02, 2024


Let’s start with the basics: what is FLAG emission accounting?
FLAG stands for Forest, Land & Agriculture.
FLAG emissions include greenhouse gases and removals associated with:
For food companies, these land-related emissions often form a significant share of the total climate impact. FLAG emission accounting makes these emissions visible and ensures they are calculated according to GHG Protocol and SBTi guidance.
Traditional Scope 1–3 calculations mainly capture fossil emissions (energy use, transport, fuels, processing). FLAG complements this by adding the agricultural and land-use perspective, which is critical for food-sector accuracy.
FLAG accounting offers:
Because land use and agriculture are major global emission sources, FLAG helps companies understand their true climate profile.
FLAG calculations typically build on the company’s existing Scope 1–3 inventory. In addition, FLAG requires more specific information about:
The data does not need to be perfect from day one. Many companies start with the largest FLAG emission sources, and expand the detail level over time.
FLAG assessments often use a 20-year time horizon, especially for land-use change, because impacts such as forest conversion occur over long periods.
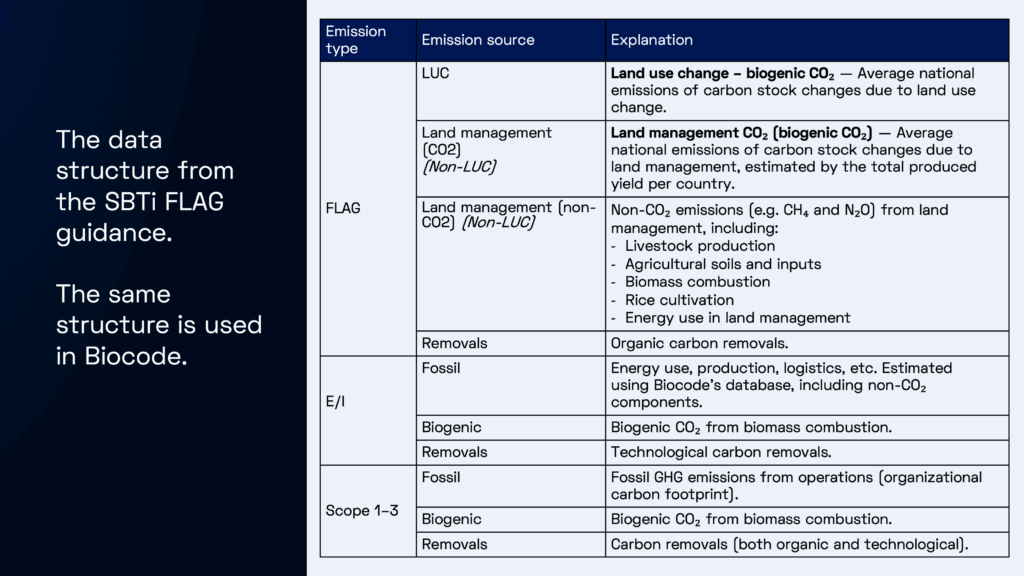
Biocode’s approach separates emissions into two groups, accordingly with the GHG Protocols Land Sector & Removals guidelines (draft version available on December 2025):
Covers traditional Scope 1–3 emissions, such as:
These are largely fossil emissions and biogenic emissions from biomass combustion.
Includes land-related emissions and removals from:
This separation prevents double counting and provides a clearer, more science-based result.
For example:
FLAG accounting is easiest when built on top of an existing Scope 1–3 inventory. In the webinar recording above, Elina Ranta describes a simple, structured process:
Biocode’s team can also model individual agricultural ingredients or complex food products if they are not yet in the database.
Companies that calculates their FLAG emissions gain:
FLAG emission accounting helps food companies look beyond operational emissions and address the real climate impact of their raw materials and land footprint.
What can you expect from a demo with Elina?

