Food carbon footprint
benchmark table
Biocode’s comparison table of food products gives an overview of how different food ingredients compare to others.
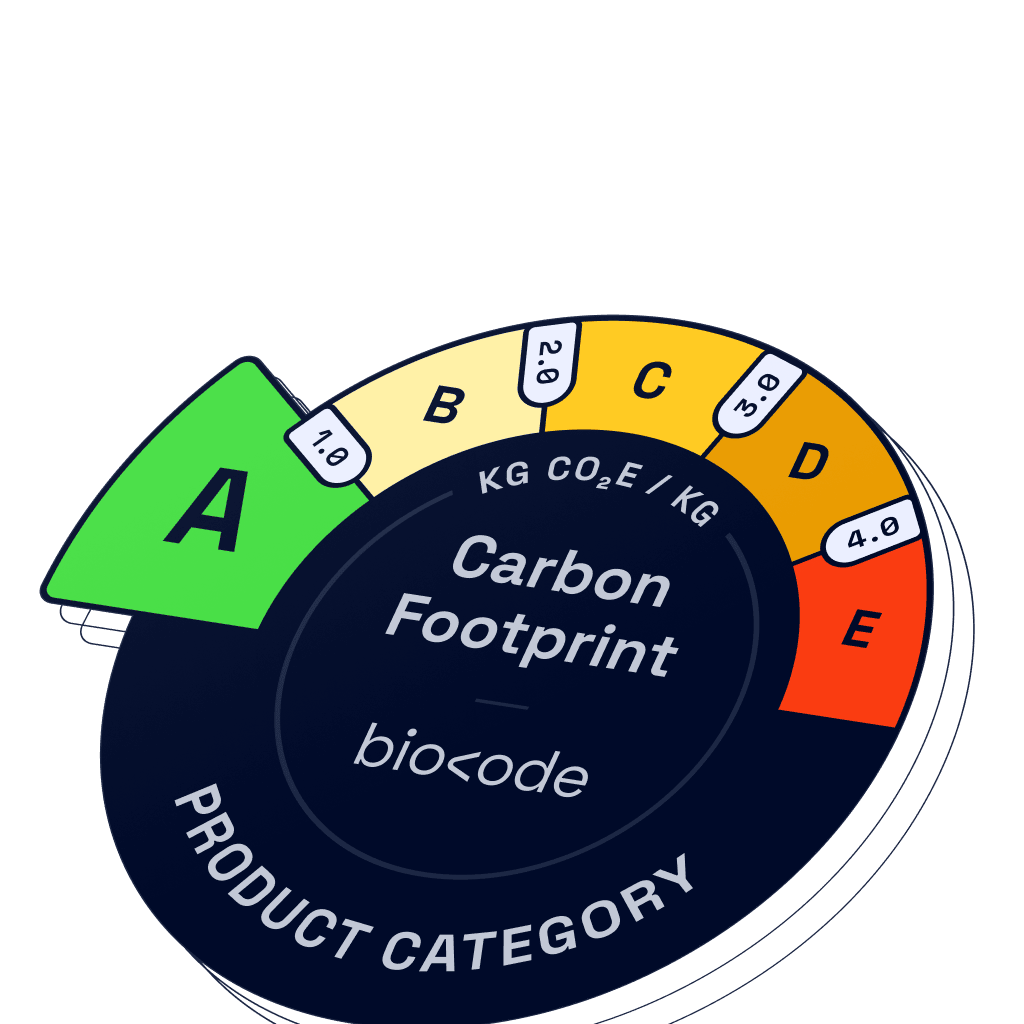
Carbon footprint classification from A-E
The product is given a classification from A to E according to the categorisation table
26 different product categories
The product’s carbon footprint is compared to other products in the same category
| Product category | A Class A Max | B Class B Max | C Class C Max | D Class D Max |
|---|---|---|---|---|
| Beverages | 0.3 | 0.6 | 0.8 | 1.1 |
| Plant-protein products | 0.5 | 0.8 | 1.0 | 1.3 |
| Fruits & Berries | 0.6 | 1.1 | 1.7 | 2.2 |
| Peas, lentils & beans | 0.7 | 1.0 | 1.4 | 1.7 |
| Roots & vegetables | 0.7 | 1.3 | 1.8 | 2.4 |
| Mushrooms | 0.9 | 1.7 | 2.6 | 3.4 |
| Spices | 1.1 | 1.6 | 2.1 | 2.6 |
| Breads, cookies & pastries | 1.3 | 2.1 | 2.9 | 3.7 |
| Flours, cereals & grain products | 1.3 | 1.9 | 2.6 | 3.2 |
| Dairy & plant milk products | 1.5 | 2.6 | 3.8 | 4.9 |
| Nuts & seeds | 1.5 | 2.4 | 3.4 | 4.3 |
| Eggs | 1.8 | 2.0 | 2.3 | 2.5 |
| Ready meals | 1.9 | 2.6 | 3.3 | 4.0 |
| Chips & snacks | 2.5 | 3.2 | 4.0 | 4.7 |
| Ice creams, sweets & chocolates | 2.5 | 3.2 | 4.0 | 4.7 |
| Sauces, fats & oils | 3.1 | 5.1 | 7.0 | 9.0 |
| Fish & fish products | 3.2 | 6.2 | 9.1 | 12.1 |
| Broiler & other poultry | 3.7 | 4.1 | 4.4 | 4.8 |
| Pork | 4.1 | 4.8 | 5.5 | 6.2 |
| Cocoa, coffee & tea | 4.4 | 8.6 | 12.7 | 16.9 |
| Custaceans & molluscs | 4.5 | 7.1 | 9.8 | 12.4 |
| Meat products | 5.4 | 10.6 | 15.7 | 20.9 |
| Cheeses | 6.6 | 8.9 | 11.3 | 13.6 |
| Other foodstuffs | 8.5 | 16.9 | 25.2 | 33.6 |
| Mutton | 21 | 26.1 | 31.1 | 37.6 |
| Beef | 24.4 | 28.8 | 33.2 | 37.6 |
kg CO₂e / kg | kg CO₂e / kg | kg CO₂e / kg | kg CO₂e / kg |
How the table works?

Biocode’s table allows you to identify how your product compares to products in the same product category. It also gives a good picture of the carbon footprints of different product categories.
Shows a carbon footprint classification from A to E.

Start calculating your product’s carbon footprint with Biocode, get a value and compare it within the suitable product category.
The categorisation contains 26 different product categories.

The comparison can be used, for example, in the company’s responsibility report, in product development or as a support for communication.
Try for free.
No strings attached.
Become part of the solution in the combat against climate change. By signing up you can immediately examine and test the carbon footprint calculations of your products.
14-day free trial, no credit card required
Experience carbon footprinting and emission calculation
Full access to try the company emission & product carbon footprint calculator
Training, support and reporting services require a paid plan. Personal use for farmers and producers is free.
